
Google Analytics For Beginners – Acquisition Report
If you are at all interested in improving your website performance or even measuring and benchmarking your traffic coming from certain channels over time then this is the report for you.
One of the most powerful features of the Google Analytics platform is the integration with the Google Ads platform. If you have any advertising running on Google then this report will give you unprecedented insight into not just how well your ads are running but also give you context around what users are searching for (if doing paid search) and how these users navigate your site post click.
In this article I look to give you a brief overview of how you can start to judge how well a channel is performing for you, particularly with regard to your google ads and the keyword report.
If you read my previous article on the Audience report you will know that you can think of the acquisition report as “where?” answering the question of: “where did my users come from?” amongst other things. Depending on the nature of your website and the channels you are using to advertise/drive traffic to your site you will be interested in different reports contained in here.
First and most importantly if you are using Google Ads to advertise your website or services you need to make sure that it is connected to your GA platform, if you are unsure of how to do this you can check my previous post for instructions on how to create remarketing audiences which shows you this.
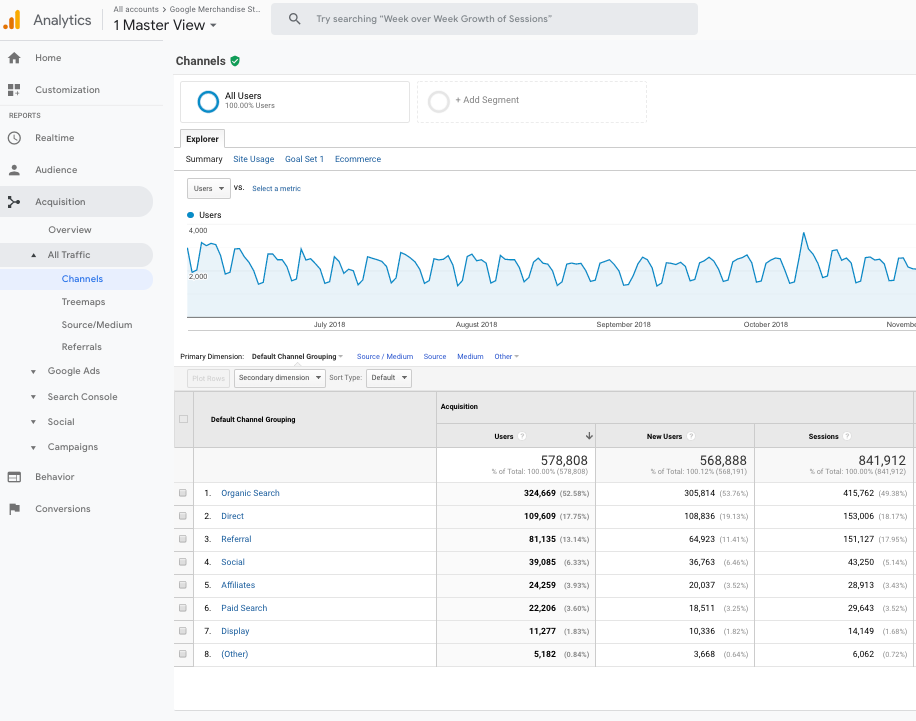
When you navigate to the Acquisition report you can get a good overview of how your channels perform for you by looking at the Acquisition> All Traffic > Channels report, depending on your level of traffic you may need to pull back the date range. What we can look at here are a few different things:
• Traffic to the site – which channels are giving you the most traffic?
• Engagement of that traffic – which channels are engaging the most with my content?
• Conversion of the traffic – what channels are converting the most on my site?
• Traffic and context– what are people searching for before they come to my website?
These questions would be a good place to start and will give you a good overview of your performance and will give you the answers (or questions) you need to drill down further. To start with lets look at the following example:
Traffic to the site – which channels are giving you the most traffic?
For our analysis we are using the google demo store which is a live store that sells Google Merchandise. You can also connect to this data here.
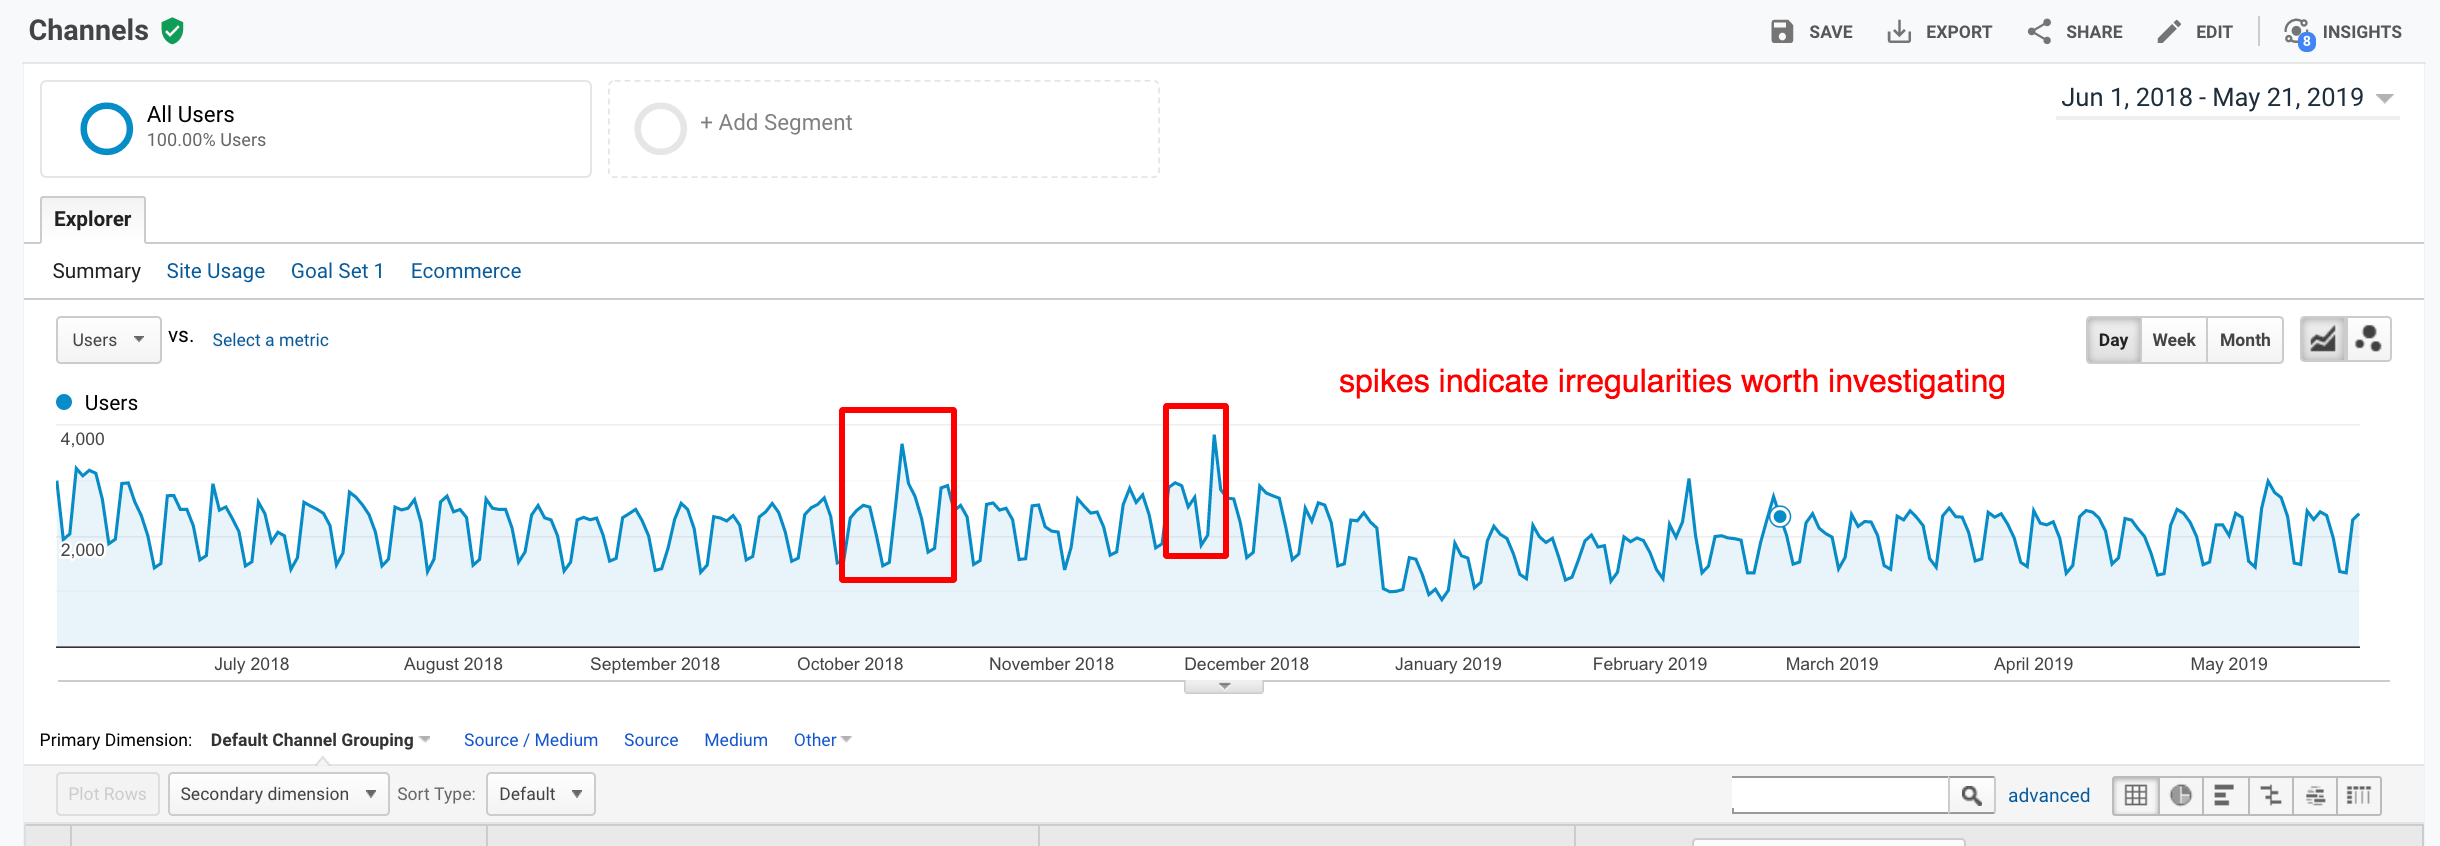
In the example below this would be easy to identify to see which channel is giving you the volume of users. An interesting thing to look at here is the trend graph, what you will generally see with most websites (particularly those with large amounts of traffic) is that there is an easily identifiable pattern.
The trend graph will allow you to see changes to this pattern, if you see a spike in traffic this could be a sign that something ie. An add, news article or some kind of content that caused a big upsurge in traffic for that day. This would be worth investigating to find out what this was and from where they came from (ideally we want to try and replicate this if the users engaged with our content). To do this I would look at the date range for the spikes then check do a comparison on those dates to the previous period and look out for large percentage differences in channel traffic. This brings us to the 2nd question.
Engagement of that traffic – which channels are engaging the most with my content?
Now just because we have a large volume of traffic from one particular channel it does not necessarily mean that we are getting good traffic. It could be that a referrer is driving a whole lot of traffic to your site through a bad user interface i.e. we have all been in that situation where you go to look at an article, click on a picture and just before clicking you get a advertisement pop up or drop down in place of the picture. What we are looking for here is quality traffic not quantity traffic. Metrics you may want to look at here are:
• Time on page – keep in mind if you have just one page this metric is going to be no good to you because GA measures time from one page to the next page.
• Bounce rate – also here depending on the use of the page this could be a good or a bad thing i.e. if your aim is to provide all information for users on one page a high bounce rate could = success.
• Avg Pages per session – if you are looking for users to explore more of your content then a higher number here is a good thing.
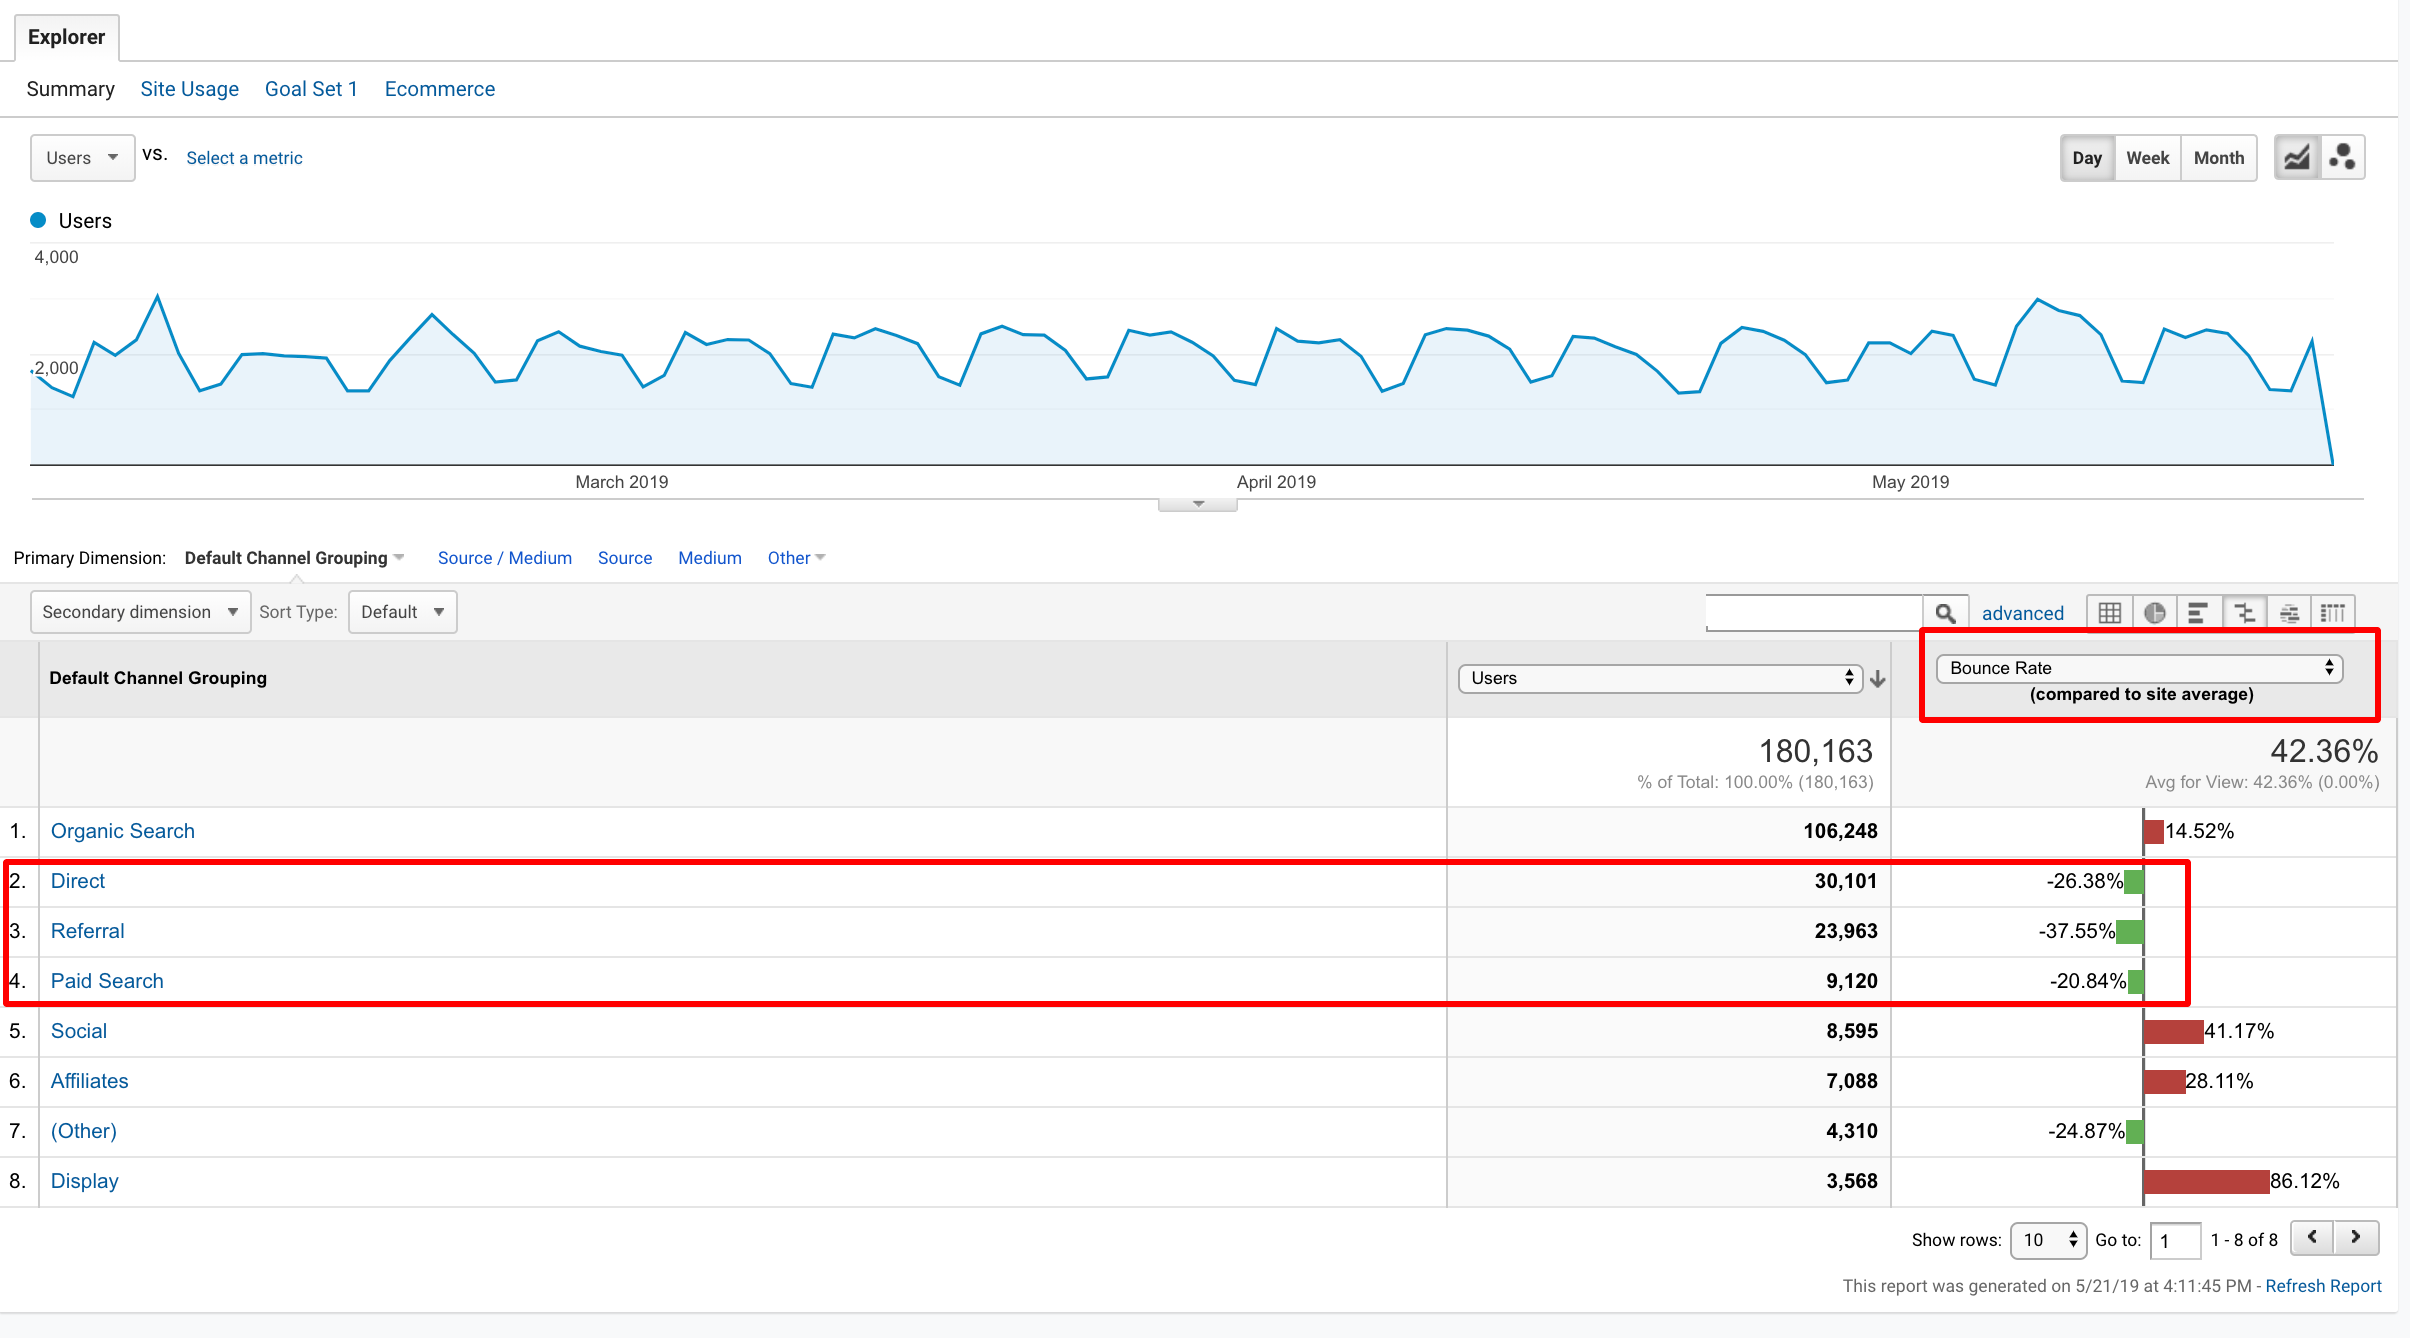
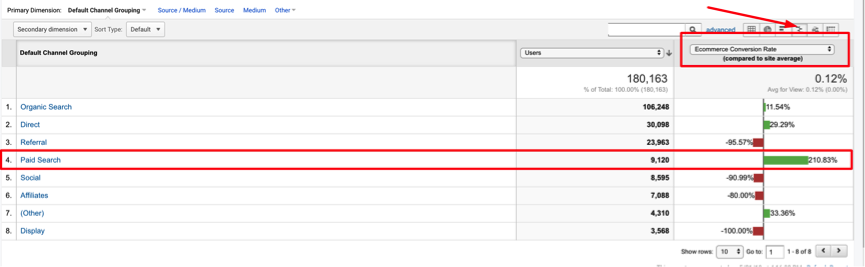
Considering these metrics in our analysis we can see that from the below report located in all traffic > channels the direct, referral and paid search seem to be the best performing in terms of bounce rate (up to over 30% less than site average). Even though these channels don’t produce the most traffic there may be potential to grow referral and paid search (for direct its hard to have any influence over).
* Tip to get the compared to average graph click on the button located next to the bar chart which is located next to the search function.
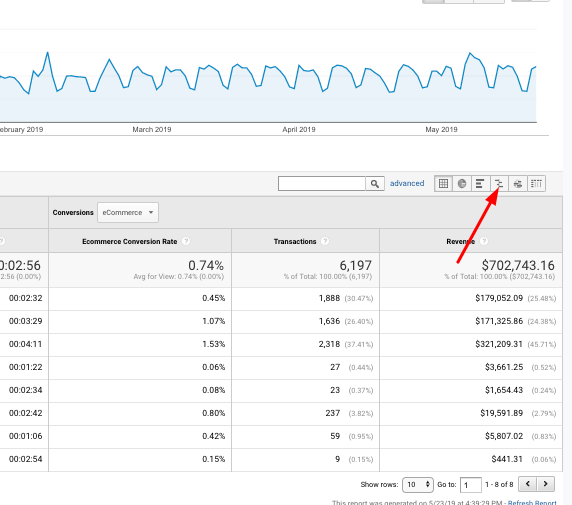
Following this up with a bit of a deep dive (clicking on the referrer channel) we can determine that the main referrer driving all the quality for the demo store here is the mall.googleplex, unsurprising as this would likely be the store that staff login to and purchase merchandise. The interesting channel for us here is the paid search channel, if we look at ecommerce conversion rate (the percentage of sessions that purchased from them) we can see that the paid search channel has a whopping 210% higher than average conversion rate over the last 3 months.
Conversion of the traffic – what channels are converting the most on my site?
Now that we know that paid search is performing well from a conversion standpoint we can look at finding out which keywords are driving this and which aren’t. If we click on paid search we will get a breakdown of keywords and the corresponding chosen metric. If you see (not set) this could be because you either don’t have your Google Ads account linked up to GA or these are part of your display campaigns.
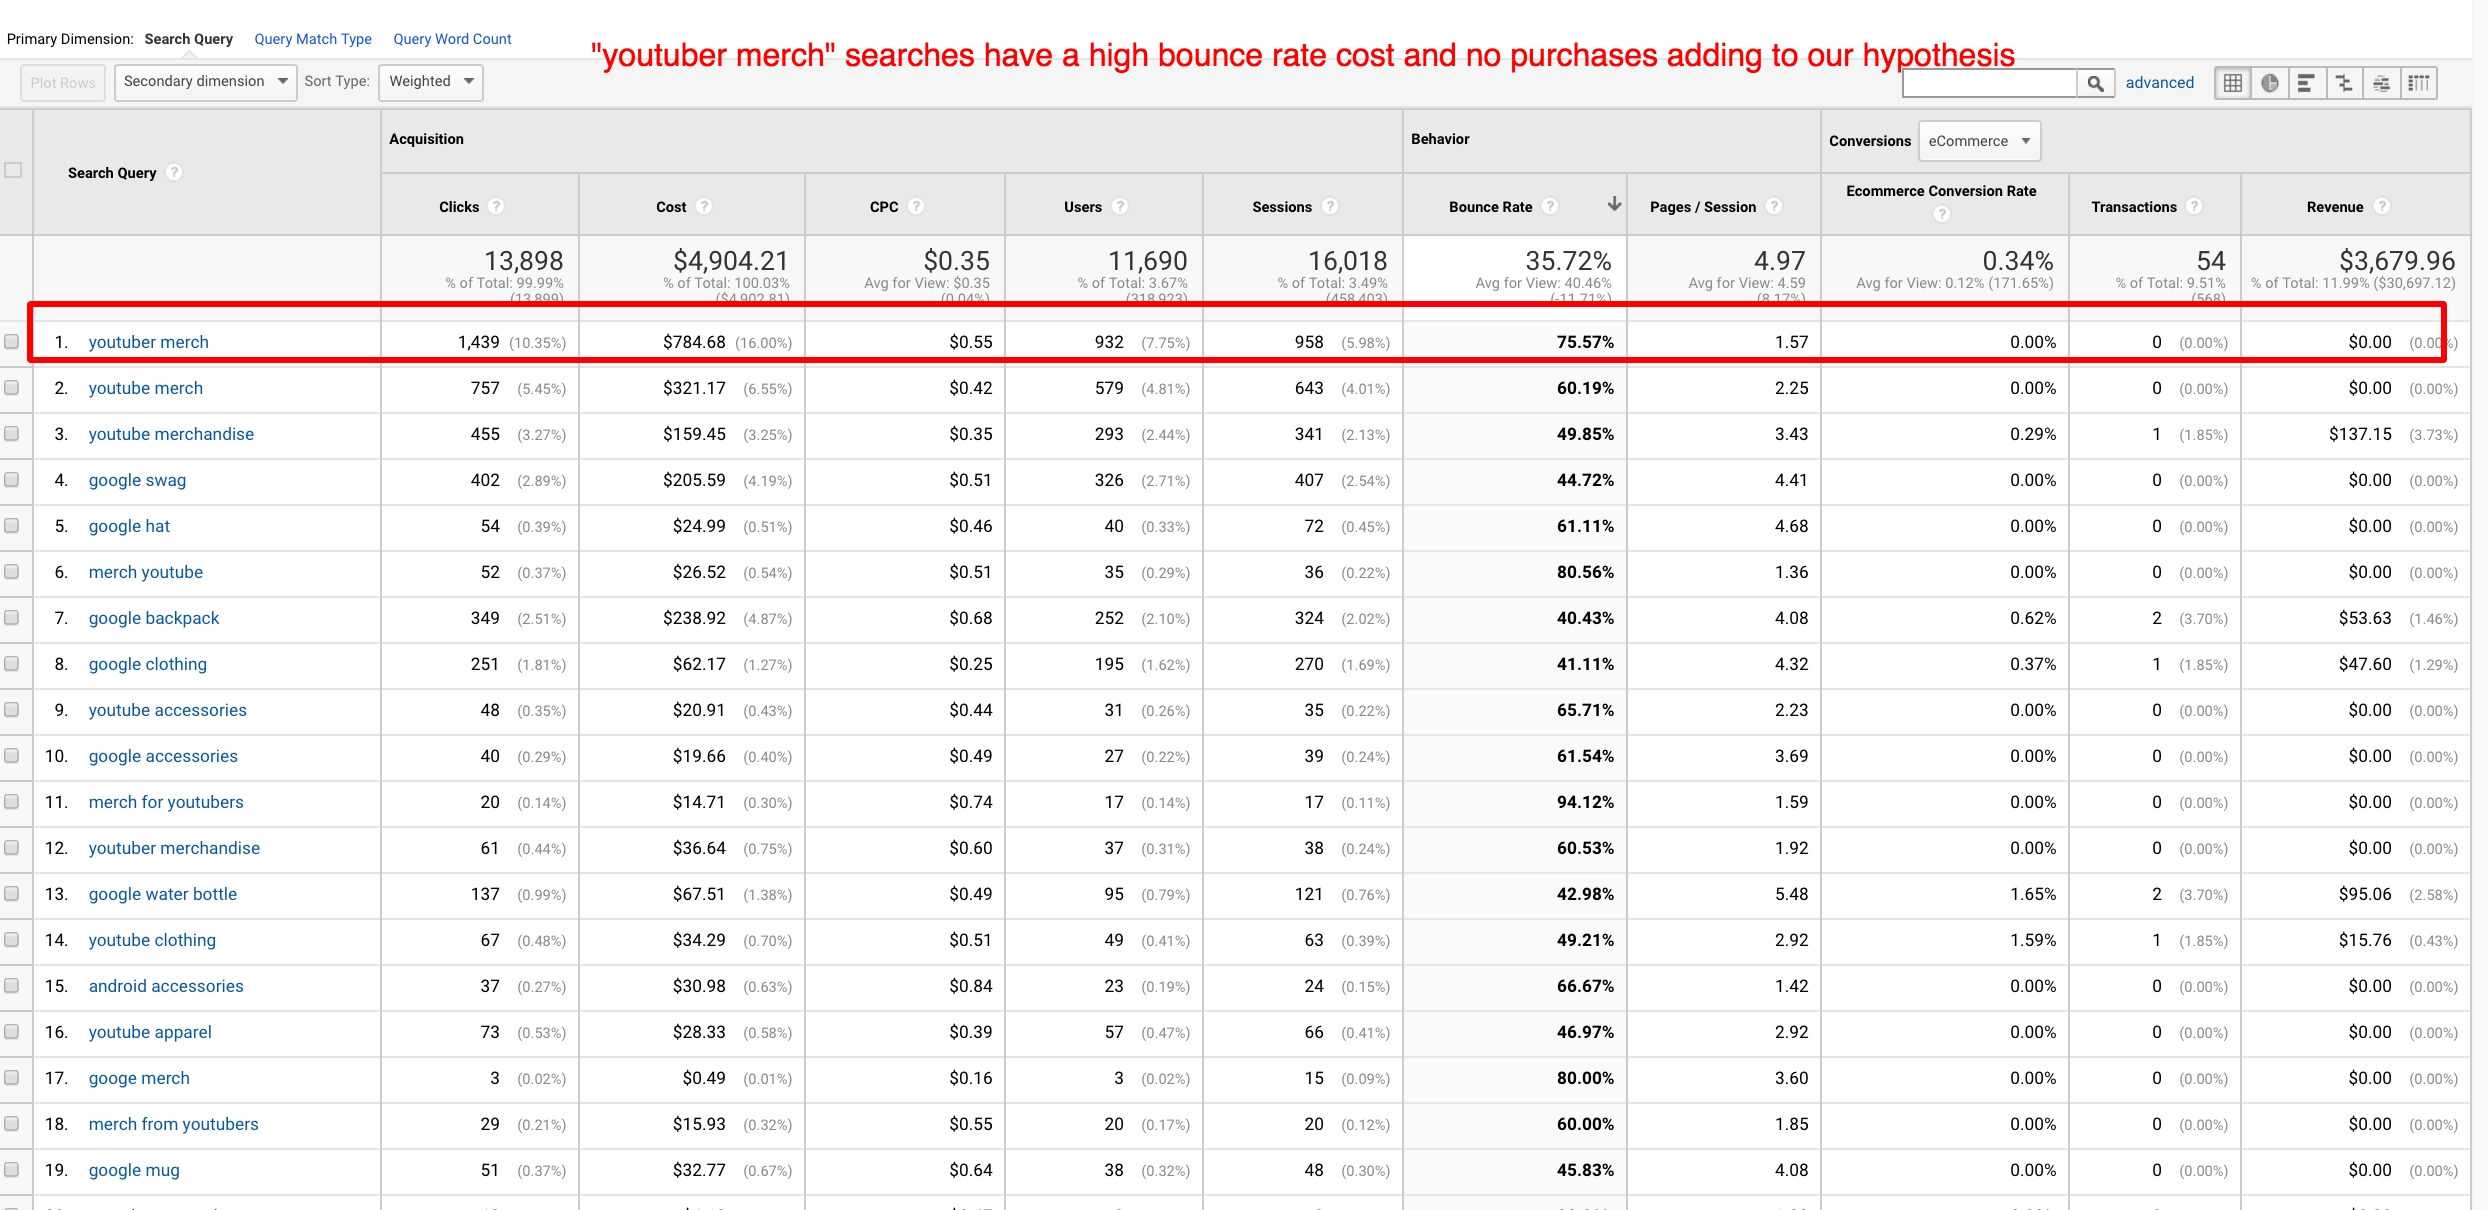
From this report we can immediately see that 3 keywords are a big driver of conversions on their paid search campaign: Google Merch, Google Apparel and Google backpack. Similarly we can see that keywords like youtuber merch are performing poorly from a conversion standpoint. My hypothesis here would be that people searching for these things are after famous youtube star apparel rather than the youtube logo style shirts this would be something worth testing out.
Traffic and context– what are people searching for before they come to my website?
This is a good question to ask if you are looking to discover new opportunities for keyword, content or targeting. Here we can get context and to see how certain users are interacting with our site after they search things. Again we can look at the main metrics as before, one thing to keep in mind is that the searches here will be unique and there will be a large volume of them, that being said, depending on the volume of traffic you may find that unique searches repeat themselves. Navigate to google ads > search queries to see what exactly people are searching for before they click on your ads.
Regardless, what we are doing here is looking for context so we can start to draw some hypothesis and develop conclusions. We also look for searches here that seem completely out of the ordinary and that should be excluded from our paid search campaigns. A good thing to do is sort by bounce rate and then filter by sort type weighted. Do you see certain patterns around keywords here that repeat themselves? Isolate the keyword and put it in the search function.
Do you see these searches performing well from a purchase/conversion standpoint or are they browsing more than one page and not just bouncing off? These could be indications that you need to add them into your keyword strategy, also this may help you develop content for your site. If users are searching one thing often and its converting a lot consider writing blog articles on it or putting information on the homepage or making it really easy for them to find the thing they are searching for.
This is just scratching the surface of what is possible with the acquisition report however I find that this is a good starting point to get you asking the questions which could help your company, business, website generate not only more traffic but more quality traffic as well as get an understanding of what your user base is looking for.
Recent Comments