

GA4 introduces a whole list of new features that extends its capabilities beyond the scope of Universal Analytics. Custom Reports in Universal Analytics offers several canned reports with limited capability to create reports and analysis. One of the most important features that GA4 presents is available under the ‘Explore’ section of GA4 referred to as ‘Explorations’.
Explorations is a collection of advanced analysis techniques to uncover deeper insights into your customers’ behavior and go beyond the standard reports by combining advanced data capabilities with data visualization. Explorations gives you access to data and analytical techniques that can be used to explore your data in depth and answer complex questions about it.

Explorations is the right option when the objective is to:
- quickly perform ad hoc queries
- easily configure and switch between techniques
- sort and drill down into the data
- focus on relevant data by using filters and segments
Exploration Techniques
GA4 provides several predefined exploration techniques that are best fit based on the purpose of the analysis. These techniques are detailed below:
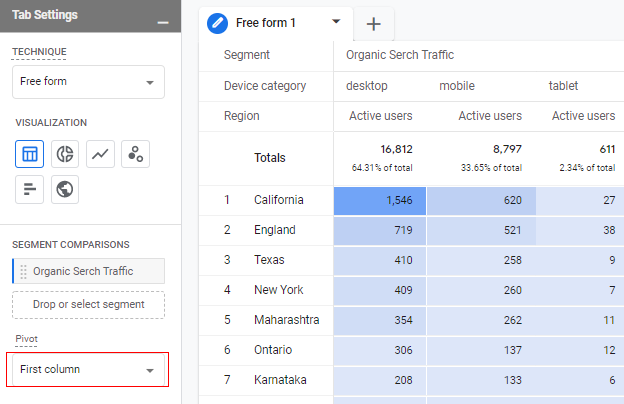
Free-form exploration
Free form exploration allows you to create a crosstab layout view of your data using various dimensions and metrics.
- Enables the ordering and arranging of data in a variety of visualization formats such as tables and graphs format
- Add multiple dimensions and metrics to one report to easily compare
- Dive deeper into the analysis by applying a variety of filters and/or segments
Cohort exploration
Cohort analysis provides insights from the behavior and performance of groups of users related by common attributes.

Funnel exploration
Funnel exploration allows you to visualize and analyze the steps users take to complete tasks on your site or app as a funnel. Funnels help to identify how you can optimize user experience and identify audience dropouts.
- A funnel of user-defined steps that shows where users succeed or fail at completing identified steps

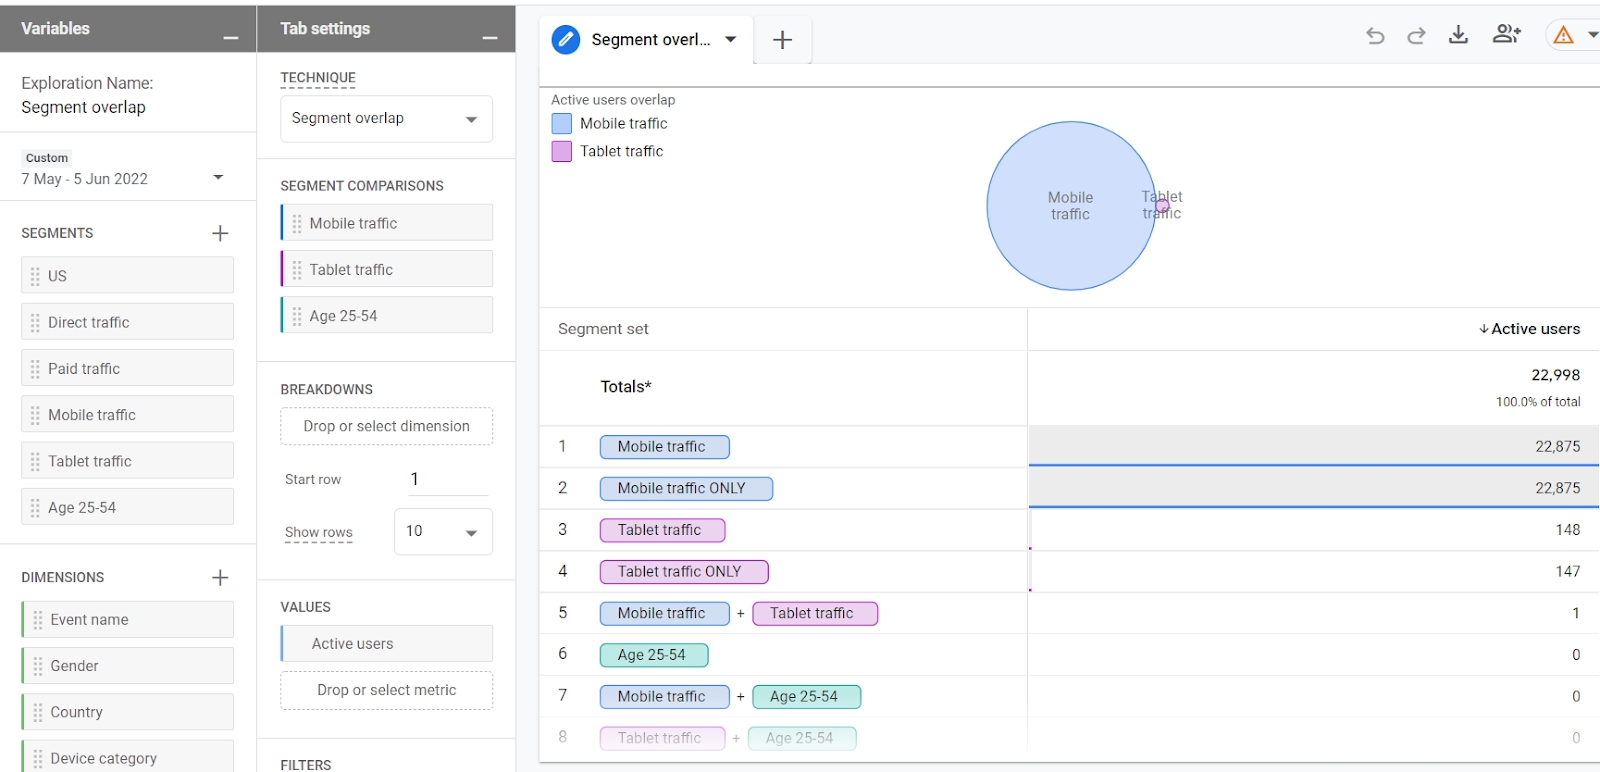
Segment overlap
Segment overlap allows you to visually see how different user segments relate to each other. You can uncover new segments of users on your site.
- Allows analysis of up to three segments
- Create new segments from the data and use them for deeper analysis
User exploration
User exploration allows you to get deeper insights about a group of users or individual users. It is useful to drill down into individual user activities
- Understand each individual’s user behavior
- Troubleshoot user anomalies and gain insights on these specific user flows

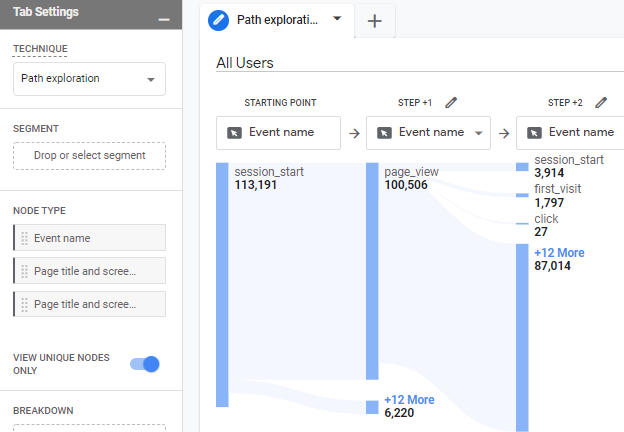
Path exploration
Path exploration visualizes the paths your users take as they interact with your website or app.
- Allows tracing the user journey path from page or event
User lifetime
User lifetime demonstrates user behavior and value over their lifetime as a customer.

Using Explorations
Access Explore
You can access your exploration reports from the left-hand menu
- On the left, click “Explore” and exploration reports open on the right.

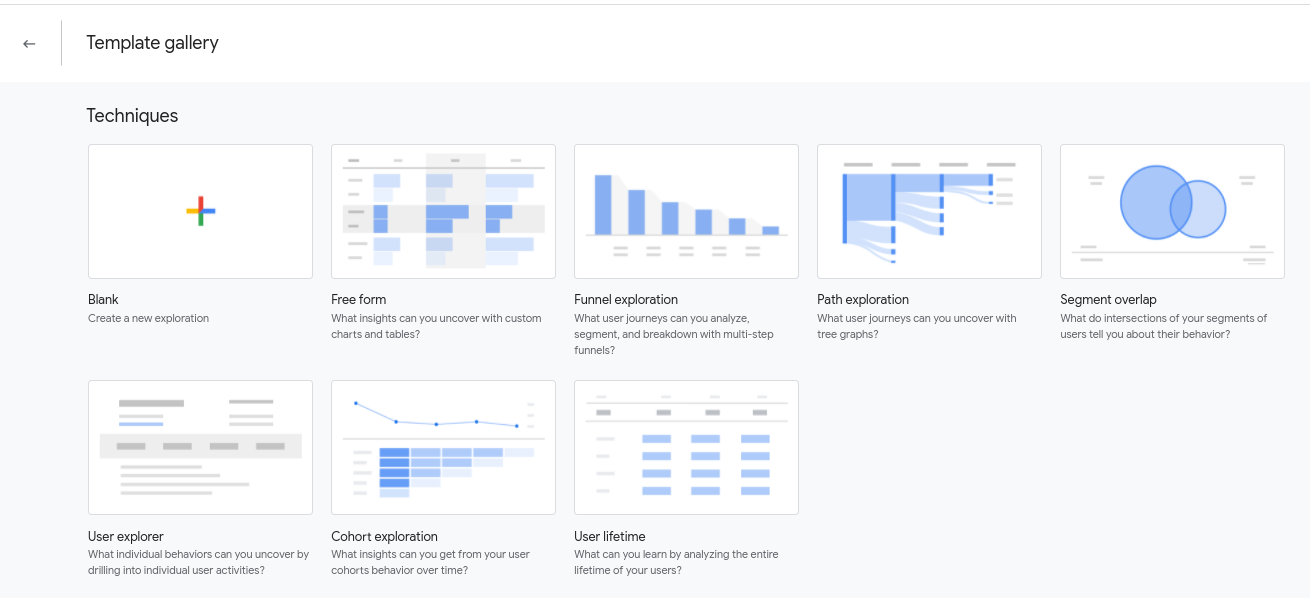
Select Template
From the list of available of templates in the explore section select the technique most suited to your analysis
Creating a new report
- When a technique is selected, you will see three tabs open up labeled “Variables,” “Tab settings,” and finally a tab where you’ll see your results once configured.
- The last tab is where you’ll receive your visual report.
- Up to ten tabs can be added for each exploration by clicking the “+” sign at the top right, and all of those will be included in the same analysis.

Configuring variables
- Analysis Name
- Give your exploration a descriptive name that identifies the report
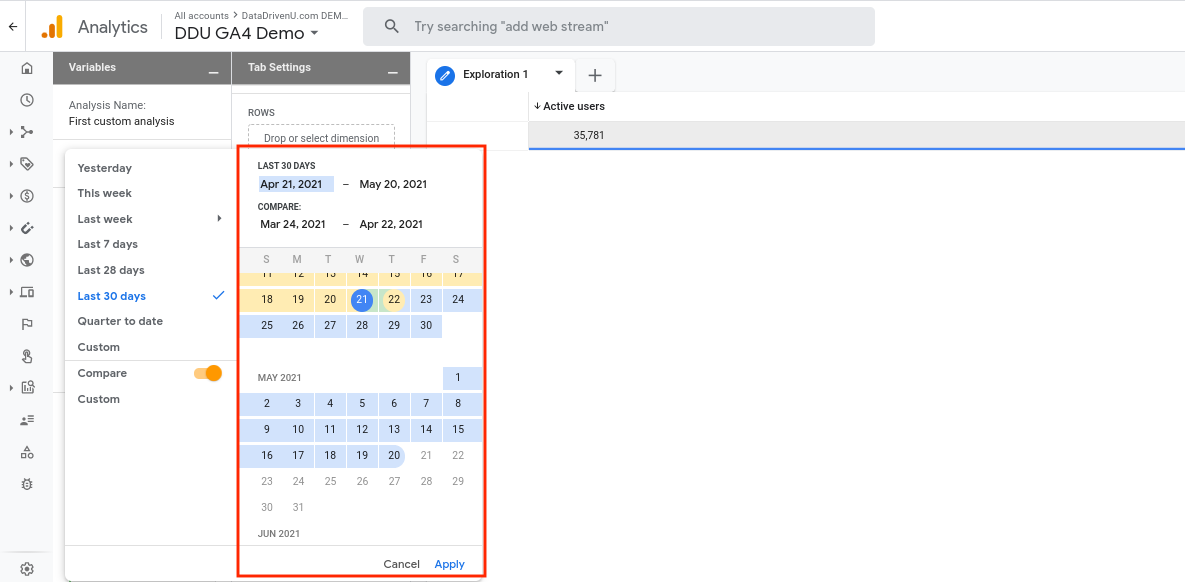
- Date range
- Choose the date range you want to analyze. You can select a custom range or one of the options on the left. You can also toggle the switch labeled “Compare” to compare two date ranges. Click “Apply” when ready.
- Segments
- Using the segments section, you can decide what users you want to include in your analysis. You can select from the menu of pre-set segments, or you can create your own by clicking the “+” sign.
- To apply a segment from the available list, just click on the three dots to the right of the segment name and then click “Apply.” You’ll then see it added to your “Tab settings” on the right.
- If you want to add a custom segment, click the “+” sign. When you do this, you’ll see a new menu come up with your segment options
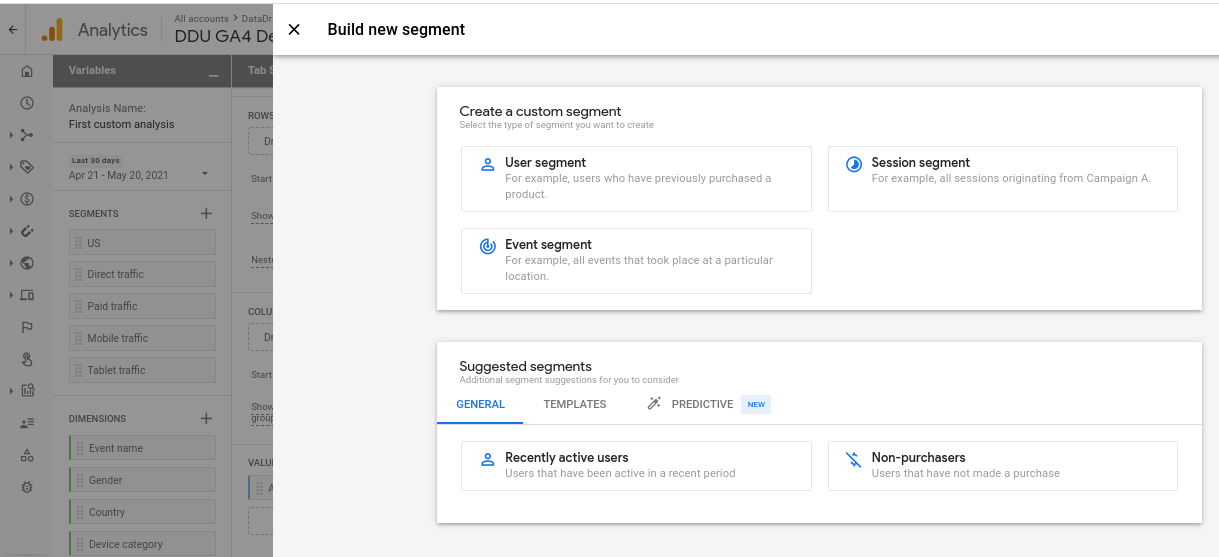
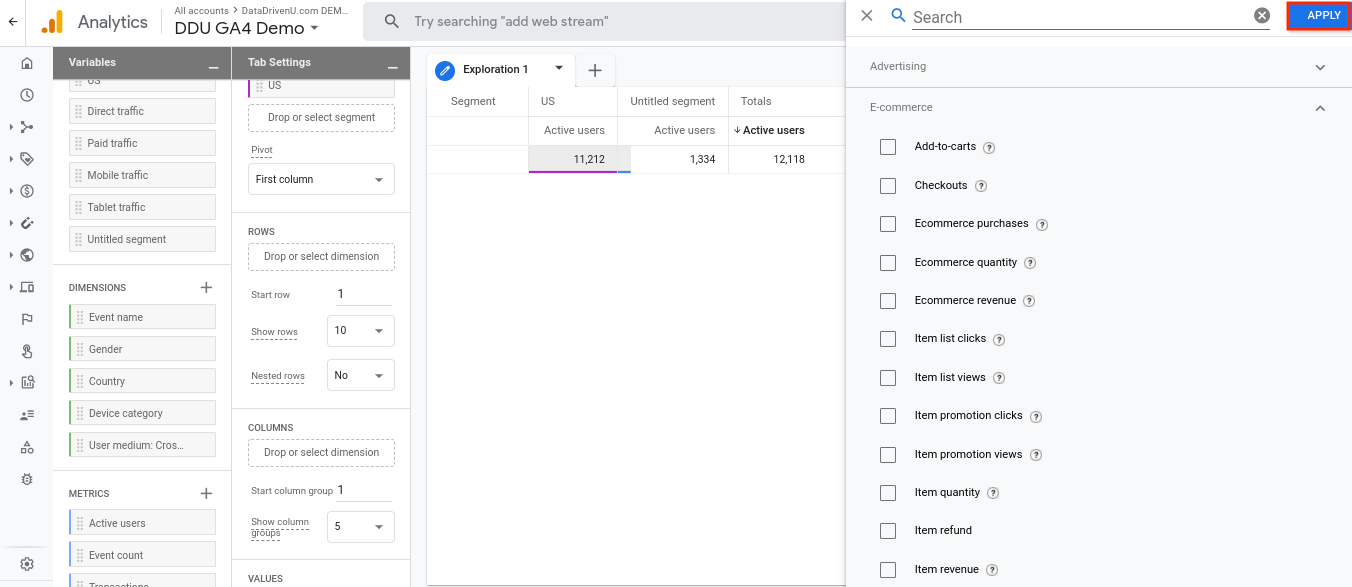
- Dimensions
- Select the desired dimensions, which allow you to categorize your data. Here, you have a list of dimensions you can add to your “Tab settings.”
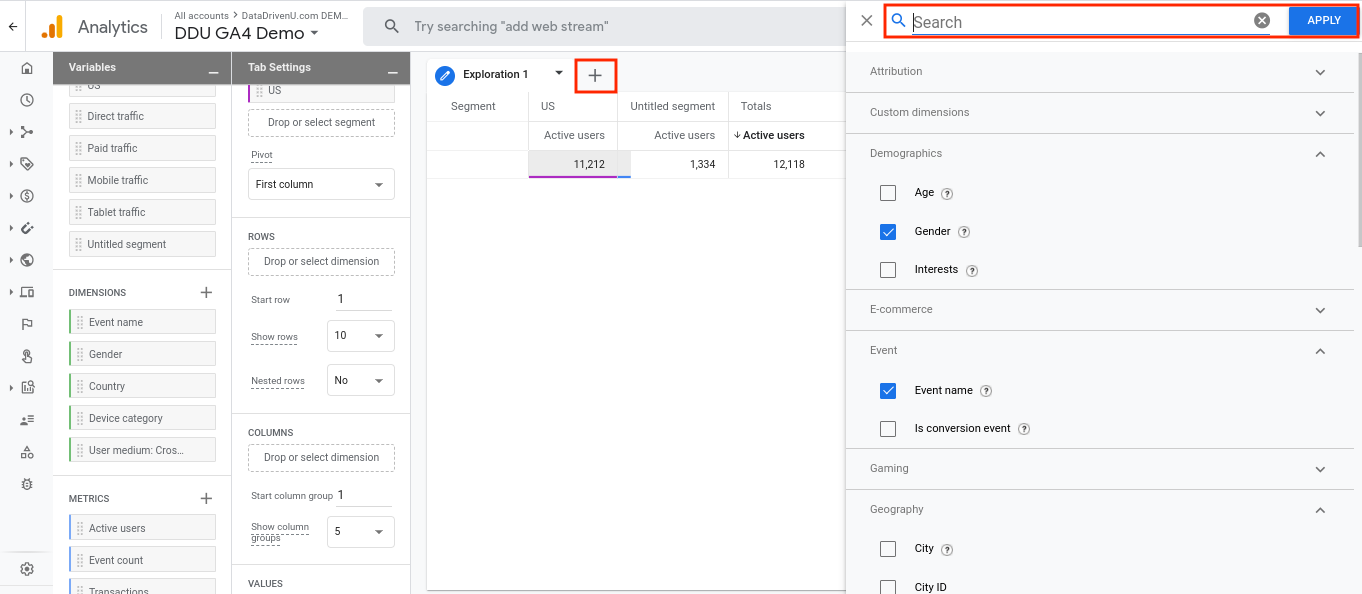
- Metrics
- Select the metrics required for your analysis
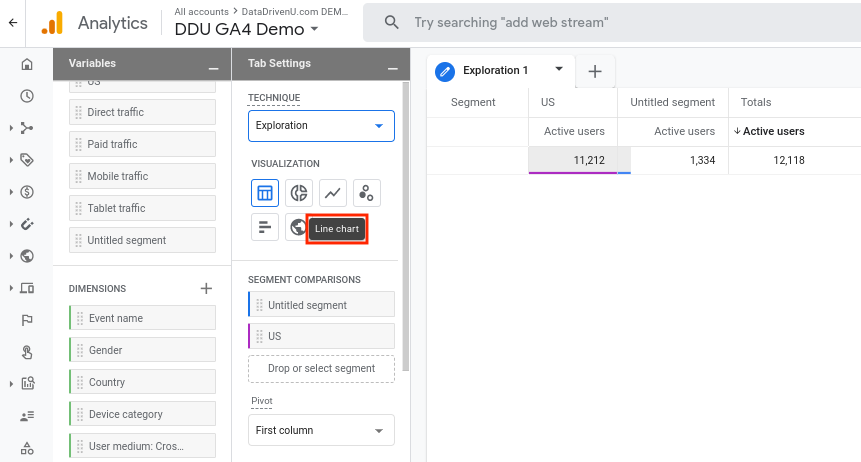
- Visualization
- Based on the selected visa technique the report will be created.
- Segment comparisons
- Any segments selected in the “Visualizations” tab are already applied, but new ones can also be selected from that tab at any time.
- Pivot
- This allows you to organize your analysis according to rows or columns.
- Rows
- Drag and drop the dimensions you set up in your “Variables” tab.
- Columns
- Just like rows, you can drag-and-drop dimensions from the “Variables” tab
- Values
- Drag-and-drop metrics you configured in the “Variables” tab
- Filters
- Select any filter to be applied to your analysis data by dragging a metric or dimension here.
Download report
Download your analysis here by clicking the download button up top. There are several options available.
To export the data for use in other tools:
- In the upper right, click Export data
.
- Select the export format:
- Google Sheets
- TSV (tab separated values)
- CSV (comma separated values)
- PDF (all tabs)
When you export to Sheets, TSV, or CSV formats, all the data available in the selected visualization is exported. This may be more data than is currently displayed.
When you export to PDF, only the data currently displayed in the visualization is
saved.

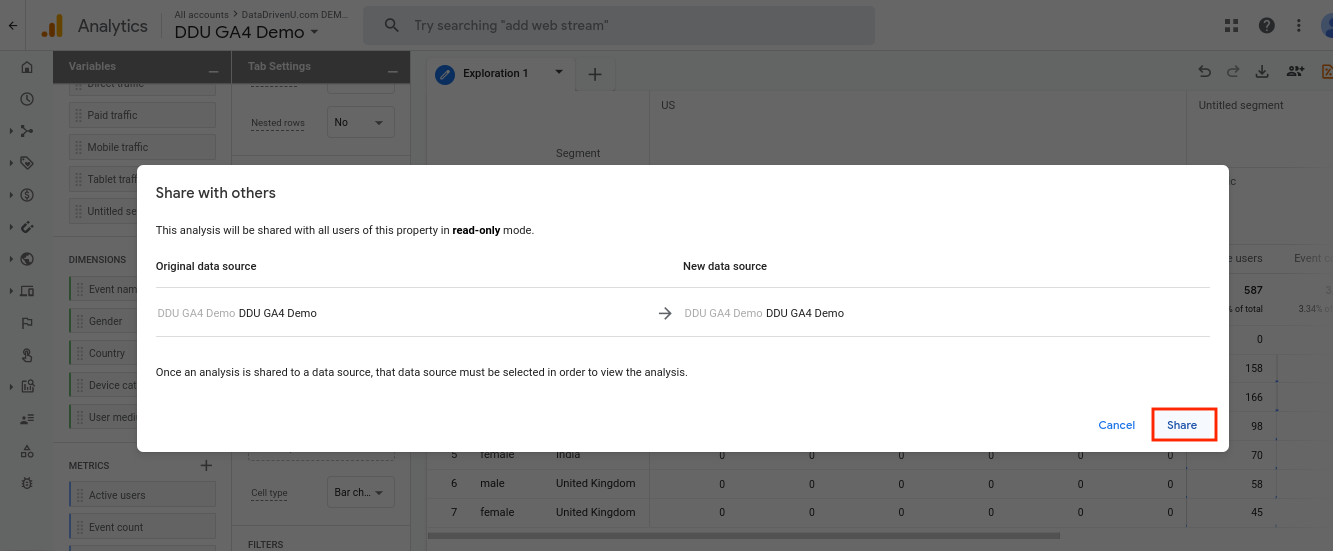
Sharing exploration report
To share your exploration with your clients or coworkers click in the upper right, Share exploration .
Shared explorations can be viewed, but not edited, by anyone who has the Viewer role to the property.
Limitations
Explorations is subject to the following limits:
- Each user of a property can have up to 200 individual explorations.
- Each property can have up to 500 shared explorations.
- Each exploration can have up to 10 segments.
- Each tab can have up to 10 filters.
Sampling and data thresholds
- When an exploration query includes more than 10 million events, Explorations may be based on sampled data.
- Any data that might identify individual users may be filtered if exploration includes demographic information or data provided by Google signals.
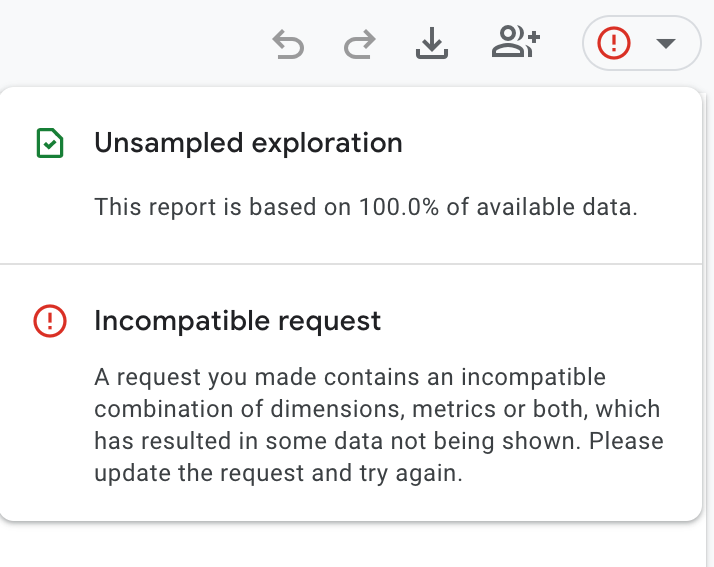
- The icon in the right corner of the exploration changes from green to yellow, when an exploration is subject to either sampling or data thresholds. A tooltip displays information about the data in the exploration.
- If your exploration contains an incompatible combination of dimensions, metrics or both you will see the incompatible request icon asking that you update the request.
Recent Comments